Profiling the CUDA calls that occur behind the scenes can help evaluate different approaches and identify performance bottlenecks in GPU-accelerated applications. The NVIDIA Visual Profiler is an easy-to-use tool that enables you to visualize the execution of CUDA kernels and API calls, providing valuable insights for optimizing your code and improving GPU efficiency.
Running a sample CUDA code
First, let’s write a basic CUDA program:
#include <stdio.h>
#include <cuda_runtime.h>

__global__ void add(int a, int b, int *c)
{
    *c = a + b;
}

int main()
{
    int a = 1, b = 2, c;
    int *dev_c;

    cudaMalloc(&dev_c, sizeof(int));

    add<<<1, 1>>>(a, b, dev_c);
    cudaMemcpy(&c, dev_c, sizeof(int), cudaMemcpyDeviceToHost);
    printf("%d + %d is %d\n", a, b, c);

    cudaFree(dev_c);

    return 0;
}
Compiling it:
$ nvcc sample.cu -o sample
Profiling calls with nvprof
We can track the GPU activity of our small test program by simply running it with nvprof:
$ nvprof ./sample
==72071== NVPROF is profiling process 72071, command: ./sample
1 + 2 is 3
==72071== Profiling application: ./sample
==72071== Profiling result:
            Type  Time(%)      Time     Calls       Avg       Min       Max  Name
 GPU activities:   56.32%  3.4240us         1  3.4240us  3.4240us  3.4240us  add(int, int, int*)
                   43.68%  2.6560us         1  2.6560us  2.6560us  2.6560us  [CUDA memcpy DtoH]
      API calls:   99.08%  165.86ms         1  165.86ms  165.86ms  165.86ms  cudaMalloc
                    0.82%  1.3800ms       101  13.663us      80ns  732.85us  cuDeviceGetAttribute
                    0.05%  81.893us         1  81.893us  81.893us  81.893us  cudaFree
                    0.02%  38.522us         1  38.522us  38.522us  38.522us  cudaMemcpy
                    0.01%  20.007us         1  20.007us  20.007us  20.007us  cudaLaunchKernel
                    0.01%  9.0370us         1  9.0370us  9.0370us  9.0370us  cuDeviceGetName
                    0.00%  6.5120us         1  6.5120us  6.5120us  6.5120us  cuDeviceGetPCIBusId
                    0.00%  1.4030us         3     467ns     281ns     831ns  cuDeviceGetCount
                    0.00%     572ns         2     286ns     121ns     451ns  cuDeviceGet
                    0.00%     220ns         1     220ns     220ns     220ns  cuDeviceTotalMem
                    0.00%     160ns         1     160ns     160ns     160ns  cuDeviceGetUuid
Here we can see the performed calls directly on stdout. Let’s do it again, but with a GUI now:
$ nvprof -o sample.nvvp ./sample
==74063== NVPROF is profiling process 74063, command: ./sample
1 + 2 is 3
==74063== Generated result file: sample.nvvp
$ nvvp sample.nvvp

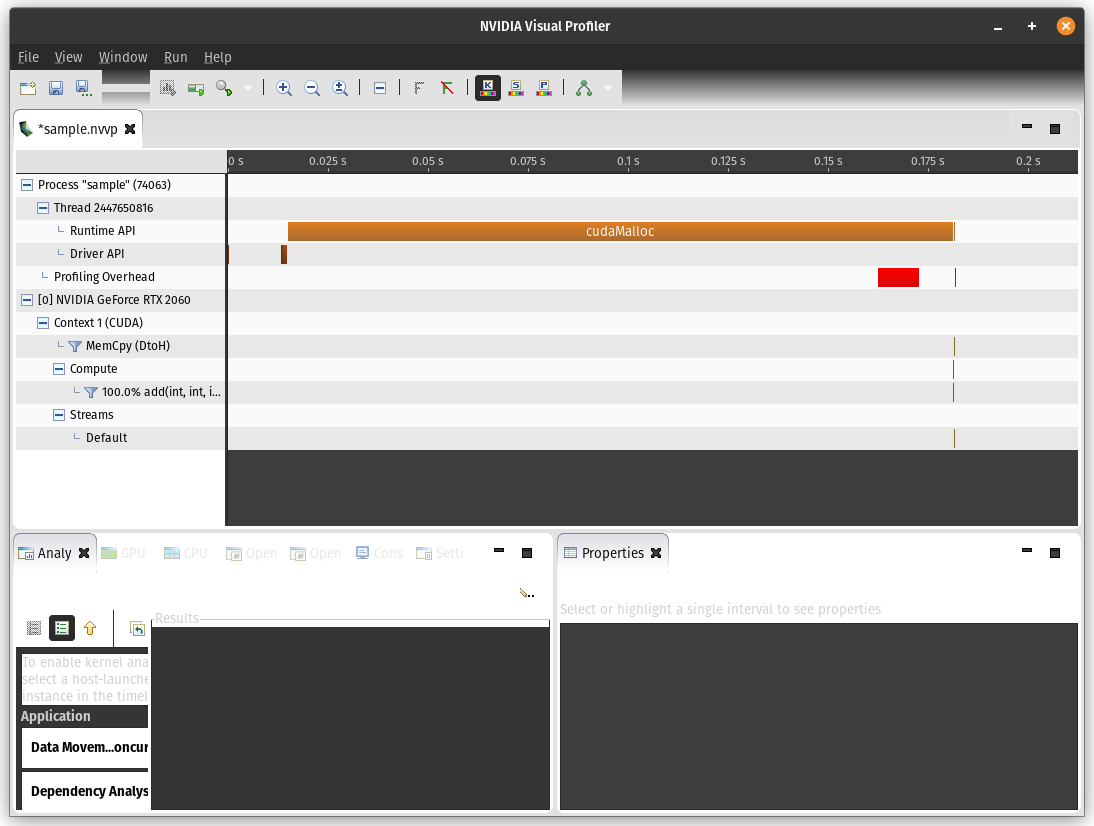
The 99% of time spent by cudaMalloc pops out immediatelly when inspecting the profiling visually.
PyTorch
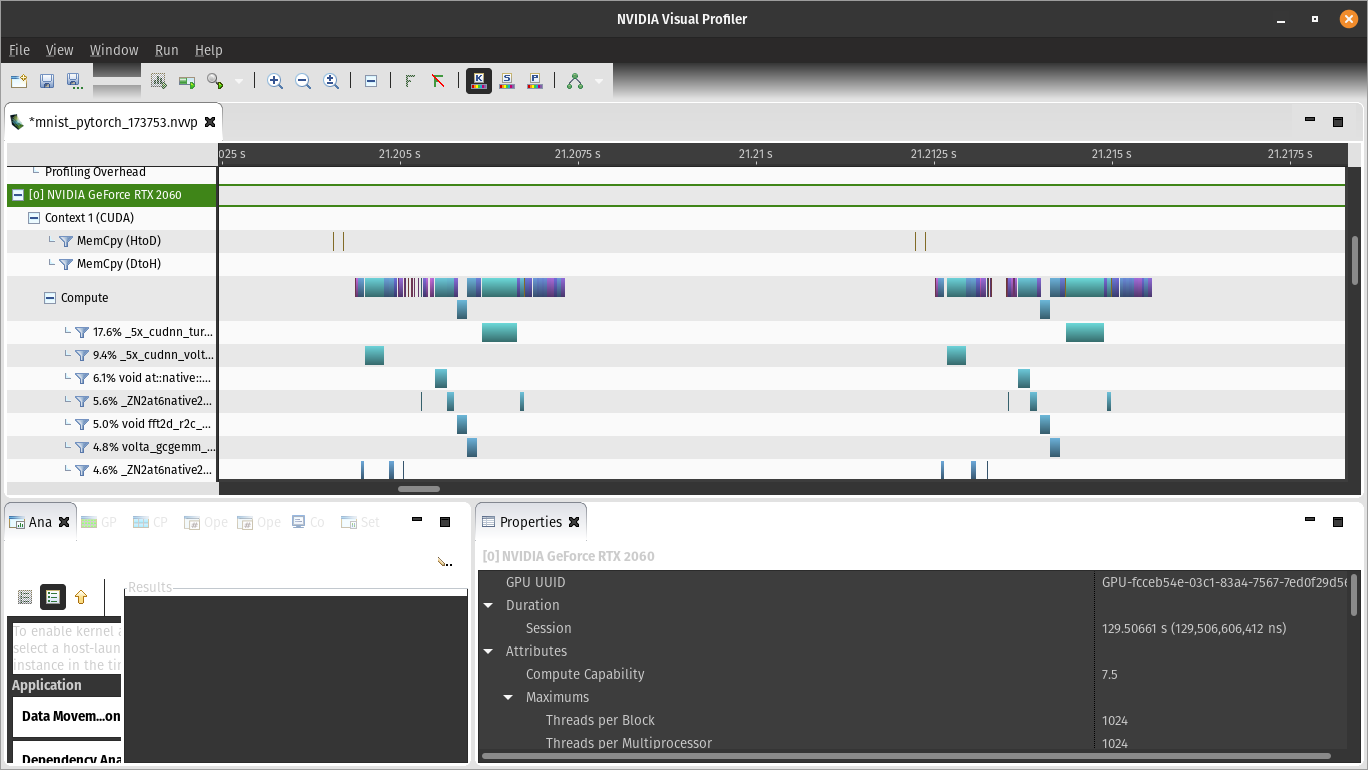
Out of curiosity, let’s check the profiling on a PyTorch MNIST example:

It’s interesting to observe the symmetry of operations on both the left and right sides. Each begins with a couple of ‘host to device’ memory copies, which I believe correspond to the digit image and its label, respectively.
